A techno-economic perspective on benchmarking aging petrochemical assets

Evaluating Aging Petrochemical Assets Through Cash Cost of Production Analysis
As petrochemical assets age, the economics of operating these plants evolve. Shifts in feedstock markets, energy pricing, trade flows, and competitive supply additions can materially change a plant’s cost position over time. In an increasingly competitive global environment, understanding the true cash cost of production is essential for sustaining profitability and guiding strategic decisions.
Cash cost of production analysis provides a clear and practical lens to assess the short-term economic viability of an existing asset and to identify opportunities for margin improvement relative to competitors.
Cash cost represents the total out of pocket expenses required to operate a petrochemical plant and is often viewed as the minimum cost at which production remains economically viable. It reflects the costs that must be covered for continued operation, excluding non-cash or corporate level items.
Understanding Cash Cost of Production
Cash cost in a petrochemical asset typically includes the following components:

Certain costs are intentionally excluded from cash cost analysis to maintain focus on operational economics. These typically include general marketing expenses, research and development, depreciation, financing charges such as interest, working capital effects, and downstream logistics such as tariffs, freight, and handling costs to the final customer.
For asset owners, revisiting and reassessing cash costs over time is critical. Without periodic re-evaluation, plants risk losing competitiveness as relative cost positions shift across regions and technologies.

Benchmarking Aging Assets with FGE NexantECA’s Cash Cost Curves
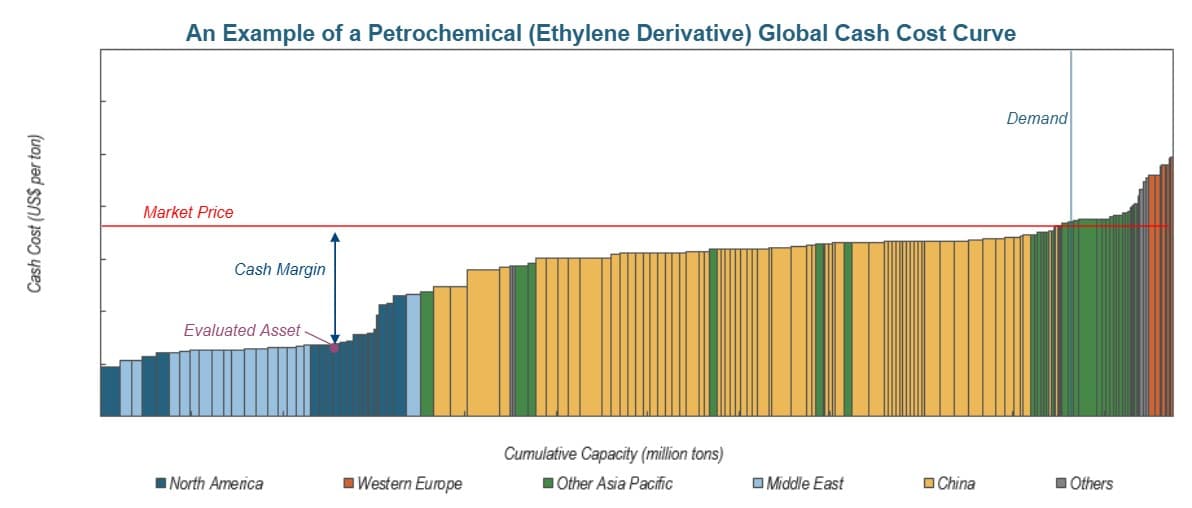
In most petrochemical markets, pricing dynamics are driven by marginal production economics. In competitive industries, market prices tend to equilibrate around the cost of the marginal producer. As a result, understanding where an asset sits on the global cash cost curve is fundamental.
Benchmarking cash costs enables producers to address several strategic questions.
Pricing and profitability
Understanding how current and forecast market prices compare to a plant’s cash cost helps determine margin resilience across cycles.
Regional and technological competitiveness
Assets positioned at the lower end of the cost curve enjoy greater strategic flexibility, including higher operating rates, stronger margins, and resilience during downturns. Producers at the upper end of the cost curve must differentiate through product quality, integration, or operational excellence to remain viable.
Structural attractiveness of an industry
Industries with steep cost curves tend to be structurally attractive, characterized by limited competition, diversified technologies, advantaged feedstocks, and wide cost dispersion. In contrast, flat cost curves signal mature technologies, many competitors, and limited cost advantage, increasing margin pressure.
Impact of structural change
Cost curves allow assessment of how new capacity additions or emerging technologies may shift industry economics and pricing over time.
An example of a Petrochemical (Ethylene derivative) global cash cost curve
With FGENexantECA’s Cash Cost Curves, we offer comprehensive cost of production benchmarking across the global petrochemical value chain, supported by deep market and technical expertise.
Global coverage with breakdowns by major regions and countries include:
North America,
South America,
Middle East,
Europe,
Asia Pacific,
Africa.
Technology and Feedstock Coverage
Ethylene (C2) and ethylene derivatives production, coverage includes:
Steam cracking using ethane, ethane and propane, ethane propane butane, naphtha propane, naphtha, naphtha gasoil, and others
Coal based and methanol based MTO routes
Bioethanol dehydration
Refinery gas recovery and other integrated configurations
Integrated ethylene derivatives include polyethylene, ethylene oxides, ethylene dichloride, styrene, ethylene glycols, linear alpha olefins and other derivatives
Propylene (C3) and propylene derivatives production, coverage includes:
Steam cracking across similar feedstock slates
Coal based MTP and MTO and methanol based MTO
Metathesis, propane dehydrogenation, and refinery grade propylene recovery
Conventional FCC and high severity FCC technologies
Integrated propylene derivatives include polypropylene, propylene oxides, acrylonitrile, acrylic acid, cumene, phenol and other derivatives
Any other petrochemical derivatives, ranging from natural gas (C1) derivatives, butanes (C4s), aromatics, and specialty chemical production
Developing Recommendations to Improve Cash Margins for Aging Assets
The Cash Cost Curve enables asset owners to identify where their plants underperform relative to peers. Common sources of cash margin gaps can be summarized as per diagram below:

Once gaps are clearly identified, structured and actionable improvement plans can be developed to close the margin gap relative to competitors.
Cost optimization strategies may include:
Feedstock sourcing optimization and contract restructuring
Manpower, utilities, and overhead cost optimization
Maintenance strategy and reliability improvement
Revenue enhancement strategies may include:
Process and yield optimization to maximize high value products
Minimizing low value byproducts while increasing monetization of higher priced streams
Re-optimization of product placement into higher margin markets
Reducing exposure to structurally low margin destinations
Operational performance improvement initiatives can further enhance margins through:
Increasing on stream factors and utilization rates
Implementing structured performance improvement programs
Re-optimizing turnaround timing and scope to reduce downtime
Asset margin analysis

Conclusion
Cash Cost of Production analysis and benchmarking are essential tools for evaluating the ongoing competitiveness of existing petrochemical assets. In an environment of shifting feedstock dynamics, evolving technologies, and intensifying competition, periodic reassessment of cash costs enables producers to protect margins, prioritize investments, and make informed strategic decisions.
Through FGENexantECA’s benchmarking analysis, including our Cash Cost Curves and targeted optimization strategies, asset owners can identify practical pathways to sustain and enhance profitability across market cycles. Contact FGENexantECA to learn more about benchmarking aging petrochemical assets from a techno-economic perspective.
Find out more…
Crude Oil-to-Chemicals (2025 Program)
This report discusses various crude oil-to-chemical (COTC) plant configurations that focus on high yields of light olefins, or aromatics, or the full range of petrochemical products while minimizing the production of traditional refinery fuels. Technologies for processing heavy crude fractions and residue streams are highlighted along with traditional petrochemical processing technologies. Process economics for various COTC configurations are provided, as are case studies to illustrate COTC configurations in operation or under consideration today.
Market Analytics: Olefins Feedstocks - 2025
This report provides a detailed analysis of the regional feedstock requirements for olefin production - ethylene, propylene and butadiene - including forecasts to 2050. Feedstocks include naphtha, methanol, ethanol, ethane, propane, butane, and gas oil. In addition, this report now includes discussion and forecasts of the development of recycled 'plastic oil' as a cracker feedstock.
Linear Alpha Olefins (2024 Program)
This report provides an overview of commercial and developing technologies for linear alpha olefins exploring the chemistry and process technology. Comparative economics and carbon intensities are presented for full-range technologies (Chevron Phillips, INEOS, Shell, ExxonMobil, SABIC/Linde, Axens, Idemitsu) and on-purpose production of butene-1 (Axens, Zeon), hexene-1 (Chevron Phillips, Axens, Sasol), and octene-1 (Dow, Sasol). A regional capacity overview is also included, with a breakdown by company in each region.
This report provides an overview of commercial and developing technologies for the production of ethylene including decarbonization options for achieving low or net-zero emissions. The report includes a Technology Readiness Level (TRL) summary for the various decarbonization options. Technology and regional comparisons of cost of production and carbon intensity (scope 1 and 2) are presented, with breakeven carbon price analysis for representative crackers with carbon capture systems. Global ethylene capacity by producer is provided.
This report provides an overview of commercial and developing technologies for the by-product and on-purpose production of propylene, the second most used chemical in terms of global volumes after ethylene. By-product propylene technologies include naphtha cracking, conventional and enhanced fluid catalytic cracking (FCC) of vacuum gas oil and atmospheric residue. This is followed by on-purpose propylene technologies that include residual grade propylene fractionation, propane dehydrogenation, metathesis, olefins catalytic conversion/cracking and methanol-based processes.
Author
Andrew Goh - Consultant
About Us - FGE NexantECA is the leading advisor to the energy, refining, and chemical industries. Our clientele ranges from major oil and chemical companies, governments, investors, and financial institutions to regulators, development agencies, and law firms. Using a combination of business and technical expertise, with deep and broad understanding of markets, technologies, and economics, FGE NexantECA provides solutions that our clients have relied upon for over 50 years.
Contact the FGE NexantECA Research team